
Figure 5.
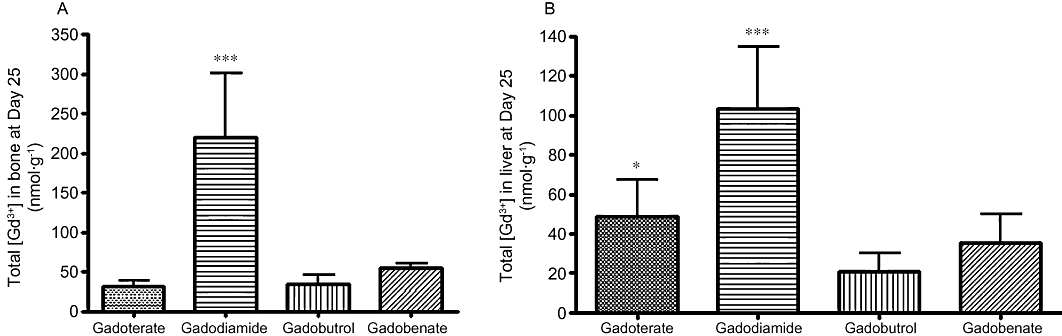
Total Gd concentration measured in bone (A) or in liver (B) samples of SNx rats fed a high-phosphate diet receiving each GC (5 × 2.5 mmol·kg−1 i.v.) on Day 25 (rat killed) (ICP-MS measurement). In untreated rats (control group), the total Gd concentration was 0.8 ± 1.2 nmol·g−1 in bone samples and below the limit of quantification in liver samples. ***P < 0.001 versus all GC-treated groups. *P < 0.05 versus gadobutrol.