
Figure 5.
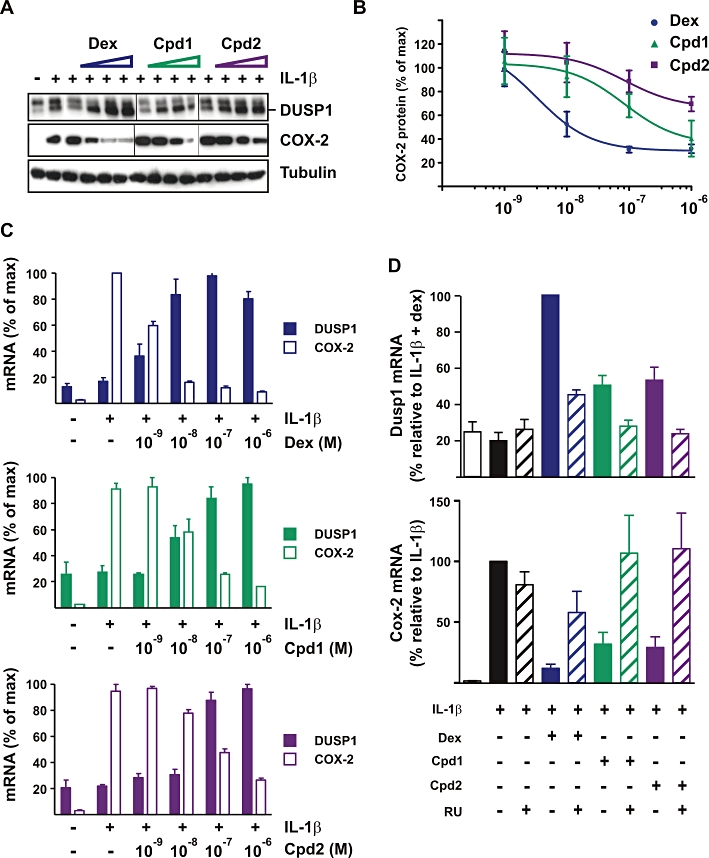
Effects of Cpd1 and Cpd2 on the expression of DUSP1 and COX-2 in A549 cells. (A, B, C) A549 cells were pretreated for 2 h with vehicle (0.1% DMSO) or increasing concentrations (10−9 to 10−6 M) of dex, Cpd1 or Cpd2 then challenged for 4 h with 1 ng·mL−1 of IL-1β. (A) Representative Western blot of DUSP1 and COX-2 protein expression. (B) COX-2 protein expression was quantified by scanning densitometry in three independent experiments. (C) Dusp1 and Cox-2 mRNA were measured by real-time PCR and plotted relative to maximum expression. Graphs show averages ± SEM from three independent experiments. (D) A549 cells were treated with IL-1β (1 ng·mL−1), RU486 (RU), dex, Cpd1, Cpd2 (each 10−6 M) in the combinations indicated. Dusp1 and Cox-2 mRNAs were measured and expressed with respect to cells treated with either IL-1β alone (COX-2) or IL-1β+ dex (Dusp1). Graphs represent averages ± SEM from four independent experiments.