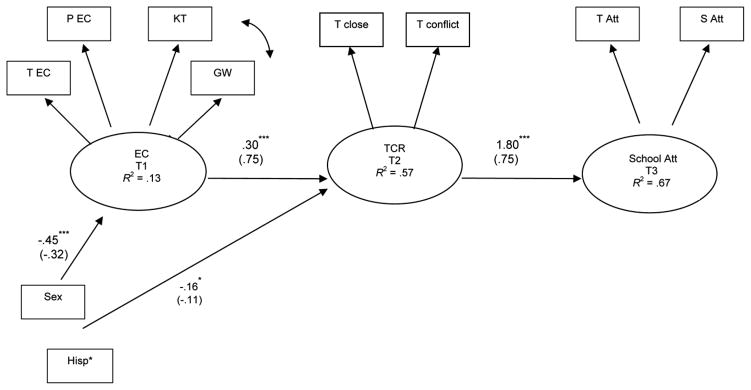
FIGURE 1.
Final SEM model with standardized and unstandardized estimates (in parentheses). Asterisks indicate that a variable is dummy coded, with Euro-Americans as the reference group for ethnicity. Variables are as follows: Hispanic (Hisp; Hispanic = 1, other ethnicity = 0). Only significant paths are shown. T = teacher; P = parent; EC = effortful control; KT = knock tap proportion correct score; GW = gift wrap latency to peek score; TCR = teacher–child relationship; close = closeness; S = student; Att = attitudes; T1 = Time 1; T2 = Time 2; T3 = Time 3. *p < .05. ***p < .001.

