Figure 1.
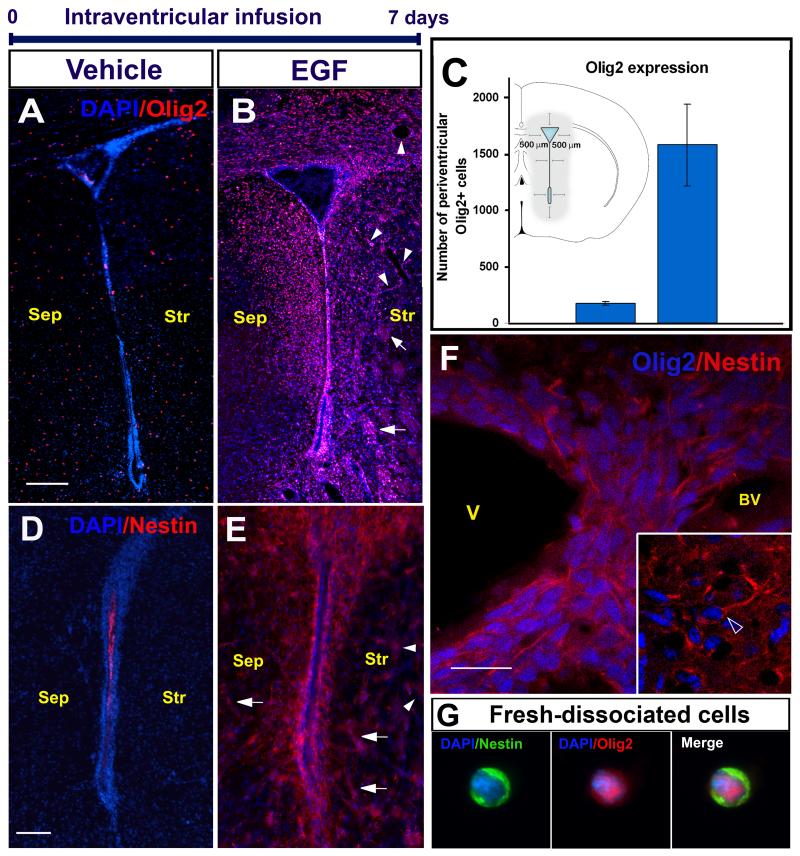
EGF effects after a 7-day intraventricular infusion. Olig2 periventricular expression in the vehicle (A) and (B) EGF group. Olig2+ cells are aligned along blood vessels (BV; arrow heads) and myelin tracts of the striatum (Str; arrows). C: EGF increases 9.6-fold the Olig2+ expression (Student’s “t” test; P < 0.05). The inserted drawing depicts the area used for quantifications. Nestin periventricular expression in (D) vehicle- and (E) EGF- infused animals. Nestin expression was also found along blood vessels (arrow heads), and myelin tracts (arrows). F: Olig2/nestin co-expression in the periventricular region (main square). Inset: Olig2+ cell showing a nestin+ leading process (open arrow head). G: Periventricular cell freshly dissociated and immunostained. Sep: Septum; V: Ventricle. Scale bar in A, B, D, E = 200 μm; F and inset = 20 μm.

