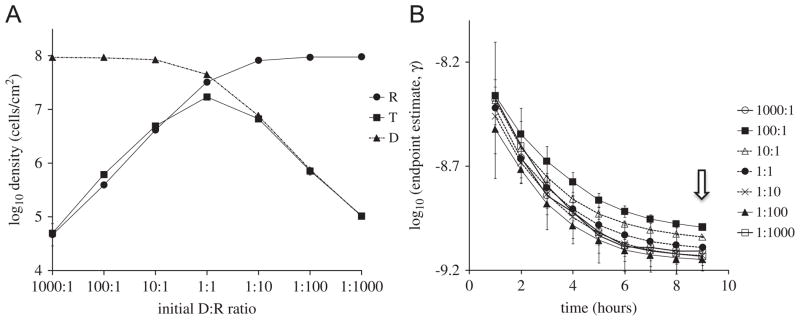
Fig. 2.
Simulated effect of initial donor-to-recipient ratio. (A) T, D, R densities sampled at stationary phase for different initial D:R ratios. (B) Endpoint estimates of conjugation rate as a function of sampling time for different initial D:R ratios, with the initial total cell density being set at 106 cells/cm2. The small scale on the y-axis is used to help distinguish between the curves. The arrow indicates the sampling time used in (A).

