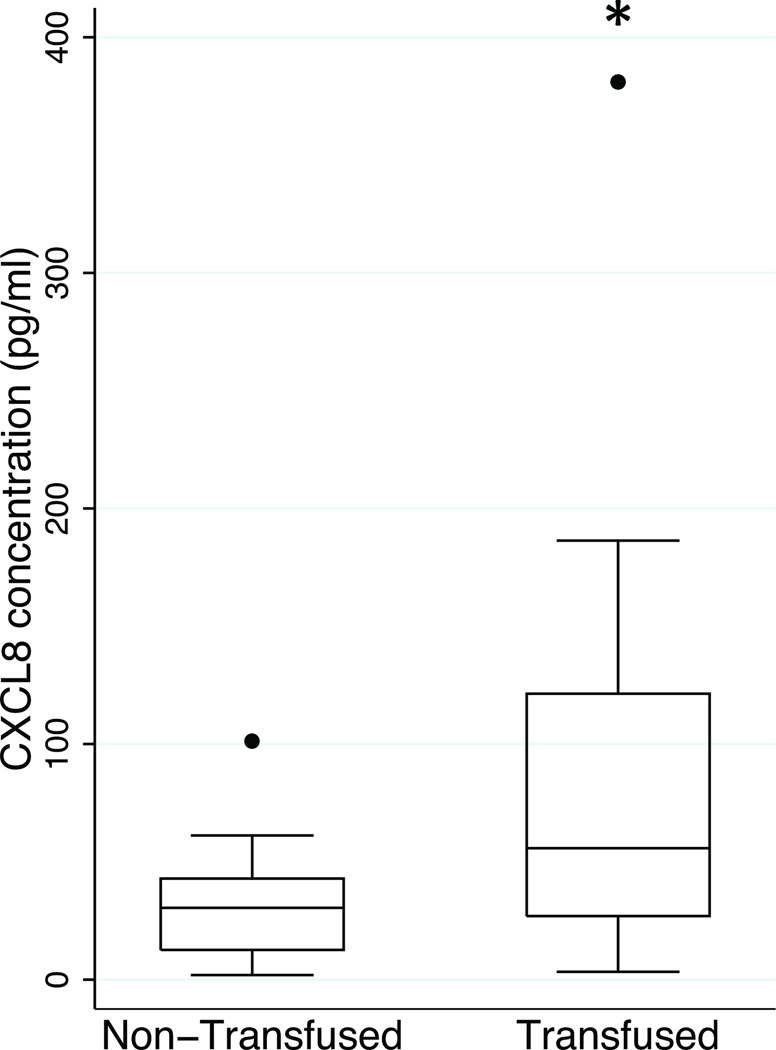
Figure 1.
Box-and-whiskers plot of plasma CXCL8 concentrations in the non-transfused and transfused groups in the first 48 h of injury. (bar = median, box = 25–75 percentile; whiskers extend to 1.5 × interquartile range (IQR) distance from the 25th and 75th percentile and, by convention, is “rolled back” to an actual data point; black circle = values greater than 1.5 times IQR). *, p=0.003; padj=0.02.

