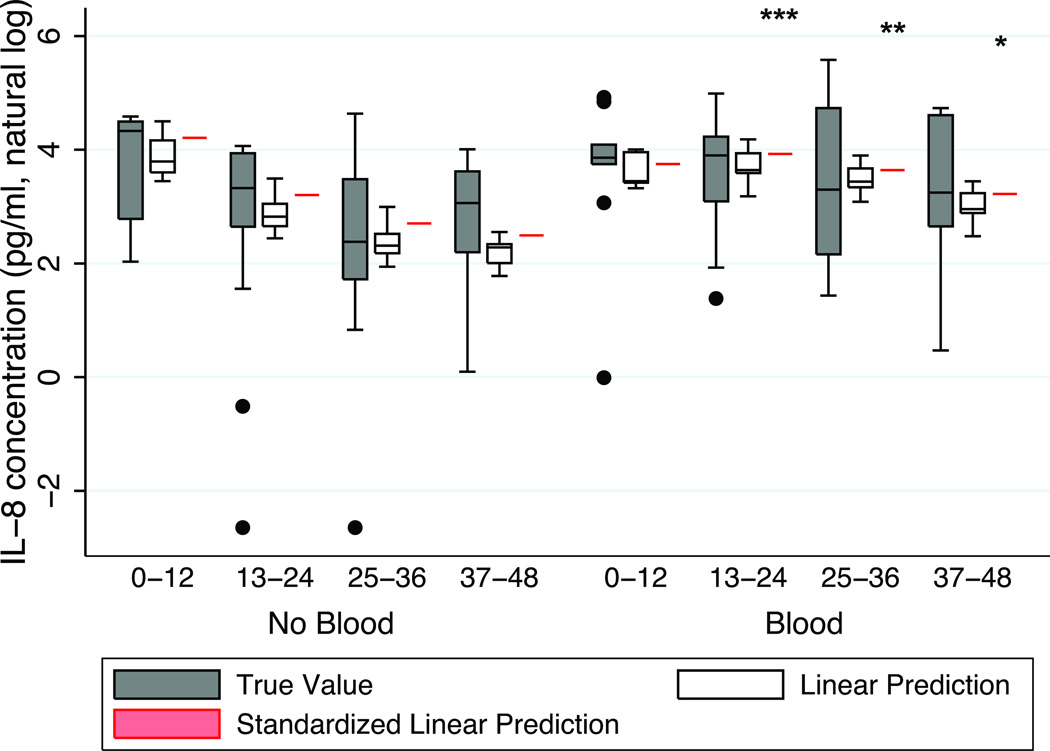
Figure 2.
Plasma CXCL8 concentrations in non-transfused and transfused groups as a function of time. Gray box-and-whiskers plot depicts the natural log transformed absolute CXCL8 concentrations. White box-and whiskers plot depicts the linear prediction of log transformed absolute CXCL8 concentrations. Red line depicts the standardized linear prediction of log transformed absolute CXCL8 concentration standardized to the mean age (41 years), mean ISS (21), mean SBP (108 mmHg), and male gender. (bar = median; box = 25–75 percentile; whiskers extend to 1.5 × interquartile range (IQR) distance from the 25th and 75th percentile and, by convention, “rolled back” to an actual data point; black circle = greater than 1.5 times IQR). ***, p=0.001; **, p=0.004; *, p=0.027.

