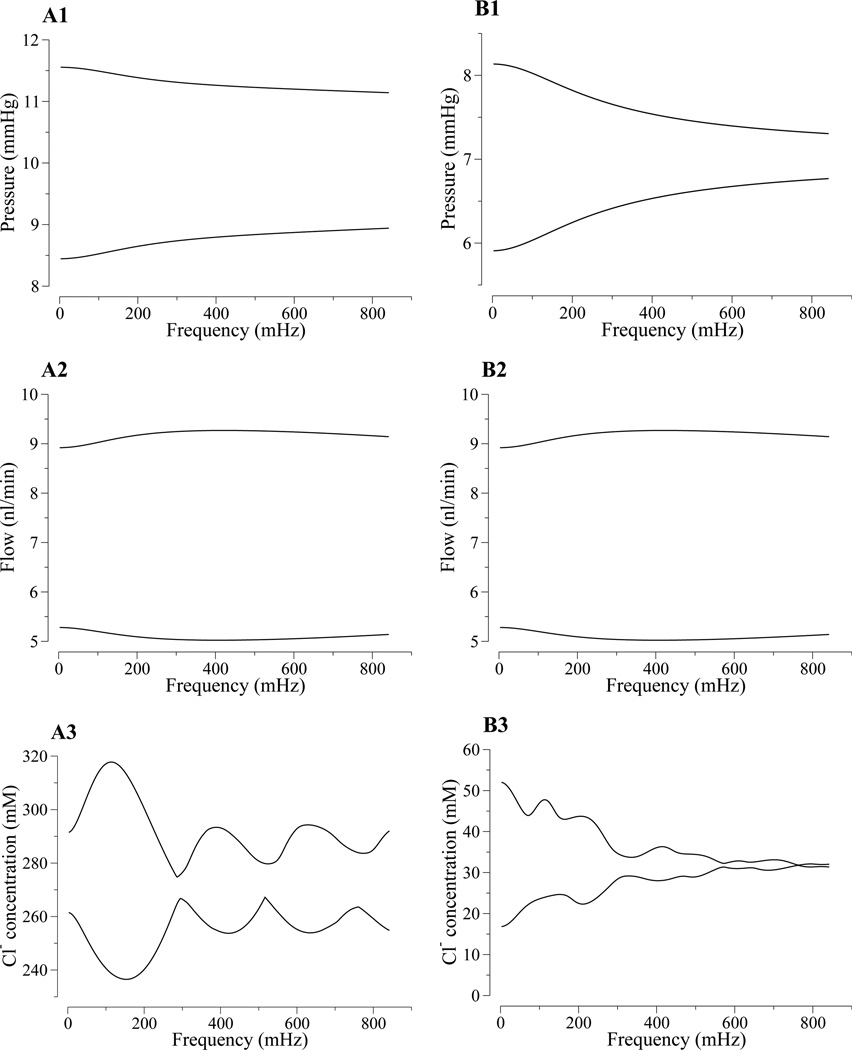
Figure 8.
Model loop frequency response arising from sustained, sinusoidal oscillations in tubular fluid pressure for a range of frequencies. Range of tubular fluid pressure (row 1), tubular fluid flow (row 2), and Cl− concentration (row 3) as a function of tubular fluid pressure frequency. Column A, loop bend; column B, macula densa.

