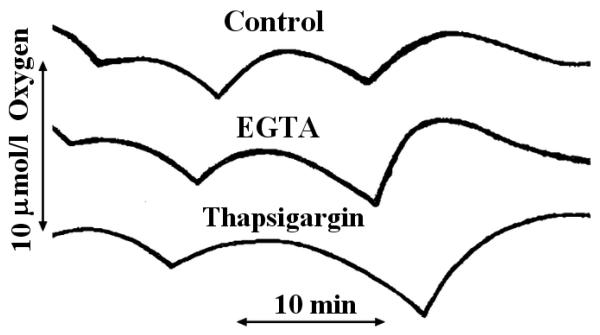
Figure. 3. Effect of different concentrations of Ca2+ on oscillations in O2 consumption.
Conditions were similar to those described for Fig. 2, except that fura 2 was omitted and EGTA (2 mmol/l) or thapsigargin (3 μmol/l) was added as indicated. These traces are representative of experiments that were repeated at least three times.

