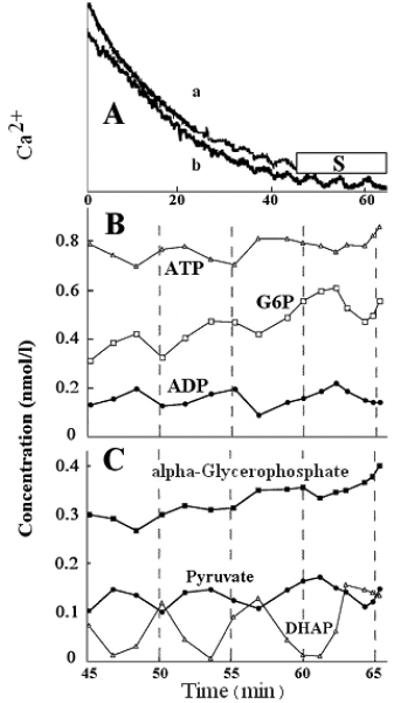
Figure. 4. Oscillations in alpha-glycerophosphate (a-GP), pyruvate, dihydroxyacetone-phosphate (DHAP), glucose-6-phosphate (G6P), ATP, and ADP.

Conditions were similar to those described for Fig. 2. The development of oscillations was monitored by following changes in Ca2+ by fura 2 fluorescence. In one experiment, after several oscillations in Ca2+ were seen (A, trace a), samples were taken in interval S at the times indicated by the experimental points in B and C and deproteinized and assayed for the metabolites. The sampling disrupted the fluorescence trace. Trace b shows the Ca2+ oscillations in a similar reaction mixture run previously and not sampled for metabolites. The Ca2+ scale ranges from ~ 100-1,000 nmol/l, but the traces have been offset.
