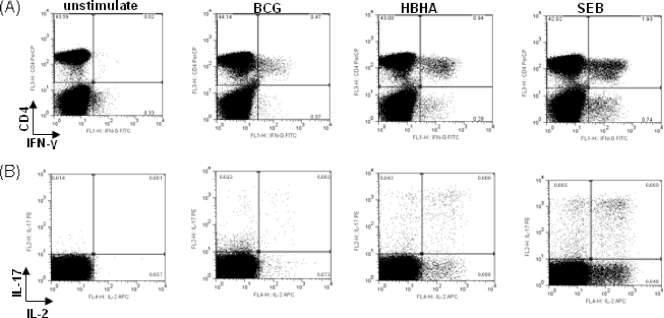
Fig 1.
A representative flow cytometric plot of the cytokine production of CD4 T cells from a healthy household contact stimulated with BCG, HBHA, or SEB. PBMCs from the HHC were stimulated for 16 h and then analyzed by flow cytometry for the production of Th1 and Th17 cytokines. The plot series in panel A are gated on the lymphocyte population in forward (FCS-A) and side (SSC-A) scatter plots of PBMCs, and the series in panel B are gated on CD4+ cells.

