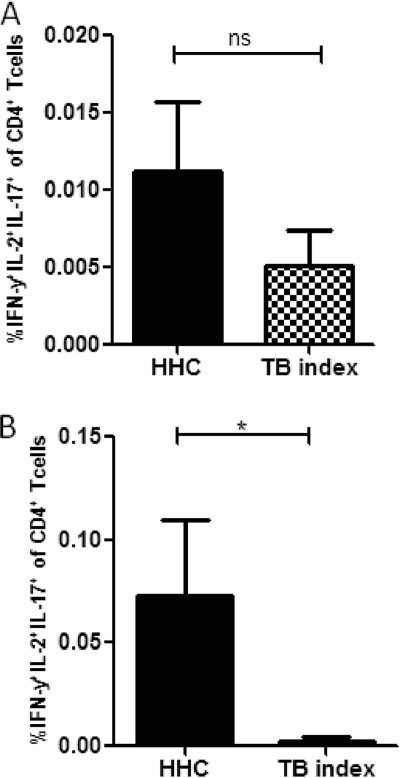
Fig 2.
Frequency of IFN-γ+ CD4 T cells expressing IL-2 and IL-17. Lymphocytes were identified by light scatter properties (FCS-A versus SSC-A) followed by a gate on the CD4+ cells. IFN-γ+ cells were further gated to analyze IL-2+ and IL-17+ cells. Coexpression of cytokines after 16 h of BCG stimulation (A) or HBHA stimulation (B) is shown. Background cytokine values from the unstimulated PBMCs were subtracted from BCG- and HBHA-specific responses. The asterisk indicates a statistically significant difference between groups when compared using the Mann-Whitney U test. Bars show the mean and the standard error of the mean (SEM).

