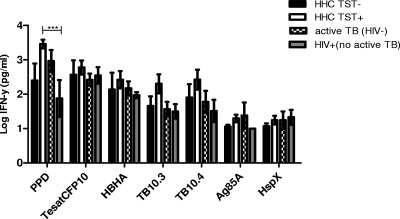
Fig 4.
Intergroup comparison of IFN-γ levels after whole-blood stimulation with mycobacterial antigens. After a 7-day incubation, supernatant levels of IFN-γ were measured by an ELISA of whole-blood culture supernatants from TST-negative HHCs (n = 4), TST-positive HHCs (n = 12), HIV-uninfected active TB cases (n = 5), and HIV-positive participants without active TB (n = 4). IFN-γ levels were log10 transformed. Graphs show the mean and the standard error of the mean (SEM). ***, P < 0.001.

