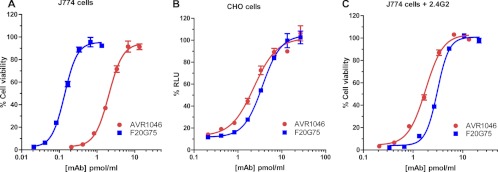
Fig 1.
Concentration dependence curves for the neutralization of protective antigen by MAbs AVR1046 and F20G75 in the J774A.1 and CHO cell-based assays. The indicated concentrations of MAb AVR1046 and MAb F20G75 were used to neutralize a constant concentration of either LT in the J774A.1 cell-based assay (A and C) or ET in the CHO cell-based assay (B). In panel C, FcγRIIB/III receptors were blocked by the addition of MAb 2.4G2 as described in Materials and Methods. Each point corresponds to the mean of the values obtained for three independent sample preparations, with the standard deviation (SD) indicated by the error bar. The samples were run on duplicate plates for the J774.1A cell-based assay and on a single plate for the CHO cell-based assay. Each curve is representative of three independent assays run on different days.

