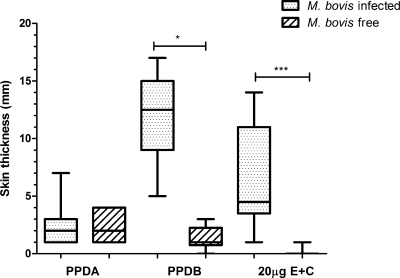
Fig 2.
Comparison of skin responses at 72 h postinjection in M. bovis-infected cattle and M. bovis-free cattle. The results are presented as medians and ranges and expressed as the difference in skin thicknesses between post- and pre-skin test readings. The statistical differences between responses were determined by using the Kruskal-Wallis test (*, P < 0.05; ***, P < 0.001).

