
Fig 6.
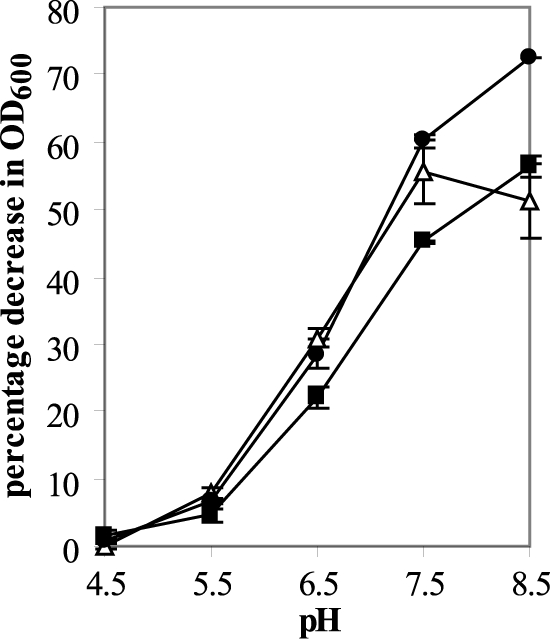
pH profile of endolysin activity. Endolysin activity was measured in a turbidity reduction assay using 10 μg crude protein extract incubated with frozen cells of C. sporogenes ATCC 17886. Results are the means from duplicate assays ± standard deviations and are plotted as the percent decrease in OD at 600 nm over 8 min of linear lysis. ■, CS74L; △, CS74L1–177; ●, CSCD.