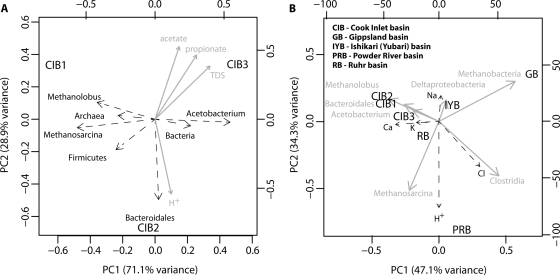
Fig 4.
(A) PCA of Cook Inlet basin microbial diversity estimates (dashed black lines) for three samples (black), with geochemical data (solid gray lines) projected as vectors onto the ordination showing correlation with microbial diversity estimates. (B) PCA of microbial diversity estimates data (solid gray lines) from five sedimentary basins (black), with geochemical data (dashed black lines) projected as vectors onto the ordination showing correlation with microbial diversity estimates data. Geochemical data are normalized by the parameter maximum prior to ordination in order to eliminate scaling artifacts.

