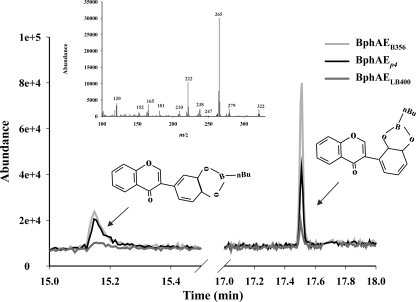
Fig 4.
Total ion chromatogram showing the peaks of metabolites produced from isoflavone after 10 min by reconstituted His-tagged BphAEB356 (gray curve), BphAELB400 (dark gray curve), and BphAEp4 (black curve). The inset shows the mass spectrum of the metabolite exhibiting a retention time of 17.5 min. The mass spectrum for the second metabolite is almost identical (not shown).

