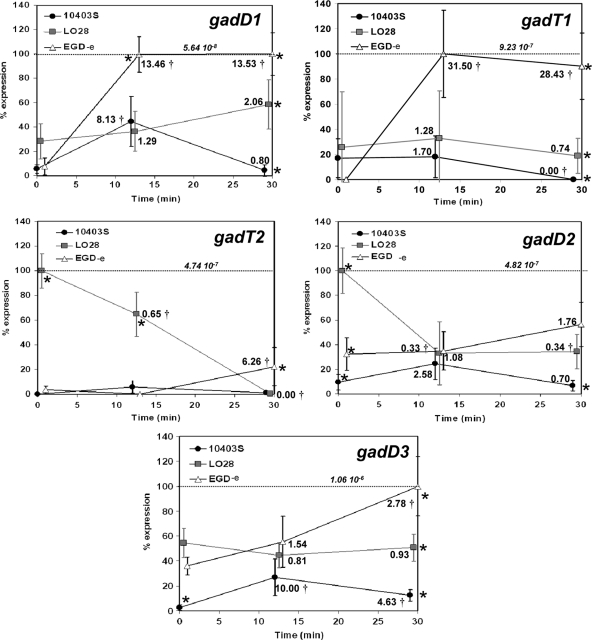
Fig 6.
Transcription of each gad gene in different reference strains in response to acidification in DM at pH 4. Relative normalized (on the basis of the 16S rRNA gene) expression of all gad genes (gadD1, gadT1, gadT2, gadD2, and gadD3) in 10403S, LO28, and EGD-e in DM before (0 min) and after (12 and 30 min) acidification in pH 4 achieved with 3 M HCl. Expression of each gene was calculated following advanced relative quantification and normalization based on its relative transcription compared to that of the 16S rRNA gene in each strain and time point. For each comparison, the data are expressed as a percentage of the maximal level detected for that transcript in all strains and under all conditions. In order to allow comparisons between the expression of the different gad genes, the actual relative normalized (based on the 16S rRNA gene) expression level for each maximum value is also indicated on each graph. The fold change of the expression of each gene in each strain compared to the initial expression at time zero was calculated, and it is indicated close to each marker. A statistically significant change (P < 0.05), as estimated by Student's t test, is marked (†). A statistical analysis comparing the expression of each gene in each different strain was performed with Tukey's multiple-comparison test, and if P was <0.05, it was deemed statistically significant and indicated on the graphs (*). Error bars represent standard deviations.

