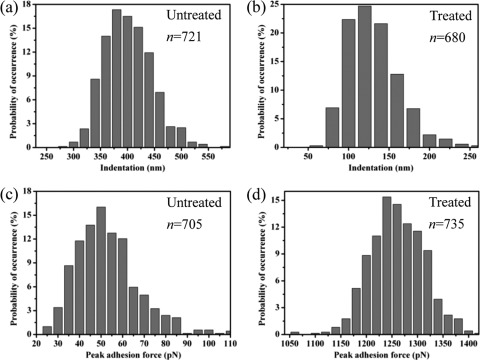
Fig 4.
Histograms showing the distributions of indentations (a and b) and peak adhesion forces (c and d) measured on untreated and hematite-treated E. coli cells. The probabilities of occurrence were normalized by the total numbers of force measurements, which are indicated by the values of n for each case.

