Figure 3.
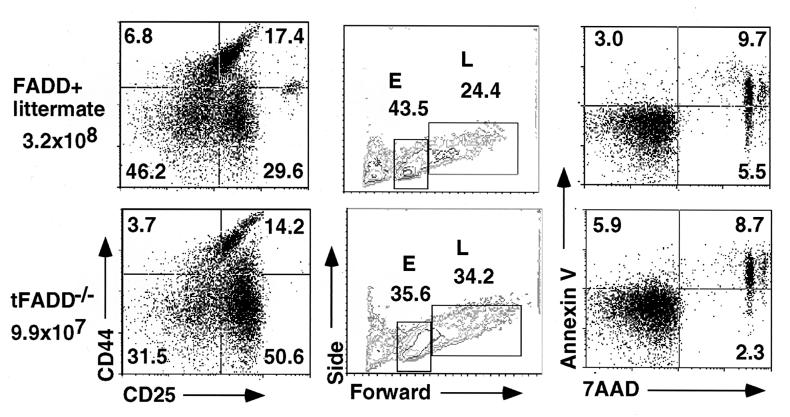
Inhibition of early T cell development in tFADD−/− mice. (a) Thymocytes were stained with FITC-conjugated anti-CD4 and anti-CD8 antibodies, PE-conjugated anti-CD44, and biotin-conjugated anti-CD25 antibodies with a streptavidin tri-color secondary. The plots represent CD25 vs. CD44 staining of the gated CD4−CD8− thymocyte population. Each dot plot represents at least 10,000 events in the DN-gated population. The genotype for tFADD−/− is Tg-FADD/FADD−/−/lck-Cre whereas its littermate control is Tg-FADD/FADD−/−. (b) The CD44lowCD25+ cells (DN3) in the CD4−CD8− population were gated to show their forward vs. side scatter for 15,000 events. E represents the small DN3 thymocytes, and L represents the large DN3 thymocytes. The genotype for the FADD+ control is Tg-FADD/FADD−/−. (c) Thymocytes were stained with FITC-conjugated anti-CD4 and anti-CD8 antibodies, followed by staining with 7-aminoactinomycin D (7-AAD) and annexin V. The profiles represent thymocytes gated for the CD4−CD8− cells. The percentage for each quadrant is displayed in the appropriate quadrant. The genotype for the FADD+ control is Tg-FADD/FADD−/−.

