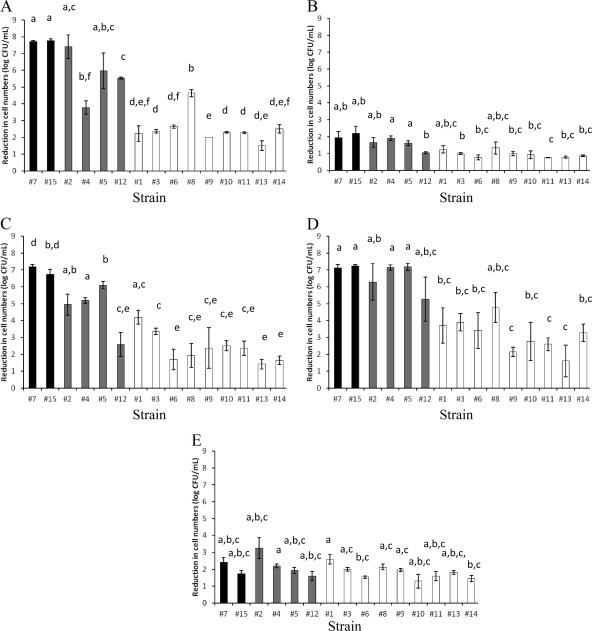
Fig 2.
Reduction in cell numbers (in log CFU/ml) for the 15 C. sakazakii strains after different lethal treatments. The averages of two independent experiments ± standard deviations are shown. (A) Acid stress (60-min treatment in LB broth adjusted to pH 2.5 using HCl). (B) Alkaline stress (60-min treatment in LB broth adjusted to pH 11.0 using NaOH). (C) Osmotic stress (dehydration for 8 days at room temperature). (D) Oxidative stress (60-min treatment in LB broth supplemented with 30 mM H2O2). (E) Heat stress (5-min treatment in LB broth at 60°C). The strains with a presumptive lack of RpoS activity are shown in black. The strains with a presumptive low/moderate RpoS activity are shown in gray. The strains with a presumptive high RpoS activity are shown in white. Strains sharing at least one lowercase letter (a to f) did not have significantly different results (P ≥ 0.05).

