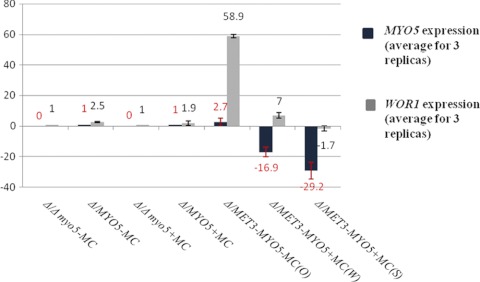
Fig 8.
Expression of WOR1 and MYO5 in strains with different sets of MYO5 copies grown in media that were inductive (SCD-MC) or repressive (SCD+MC) for the MET3 promoter. The total-RNA extract was subjected to quantitative RT-PCR to validate the conditional expression of MYO5 in opaque cells (O), in cells from “wrinkled” colonies (W), and in cells from “smooth” colonies (S) and also to evaluate the expression of WOR1 in these types of cells. All gene expression was normalized to actin gene expression (fold increase or decrease). Calibrators are Δmyo5/MYO5-MC and Δmyo5/MYO5+MC for MYO5 expression and Δ/Δ myo5-MC and Δ/Δ myo5+MC for WOR1 expression (-MC, grown in SCD-MC; +MC, grown in SCD+MC). Values are means ± standard deviations. Negative values indicate repression.

