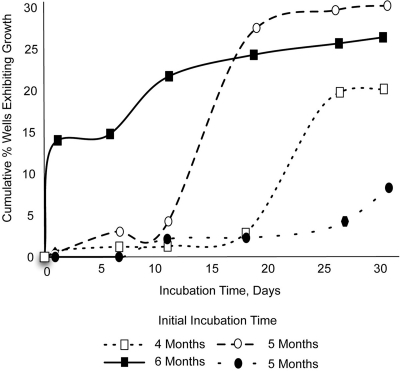
Fig 3.
Individual cells of four selected isolates show significant differences in subculture with respect to time of growth initiation. Cells were subcultured in the single-cell format, allowing for the observation of when each cell formed visible growth. Here and in all single-cell format experiments, the percentage of wells showing growth is proportional to the number of cells forming visible biomass but is not the percent recovery, because some wells in microtiter plates were unoccupied due to chance.

