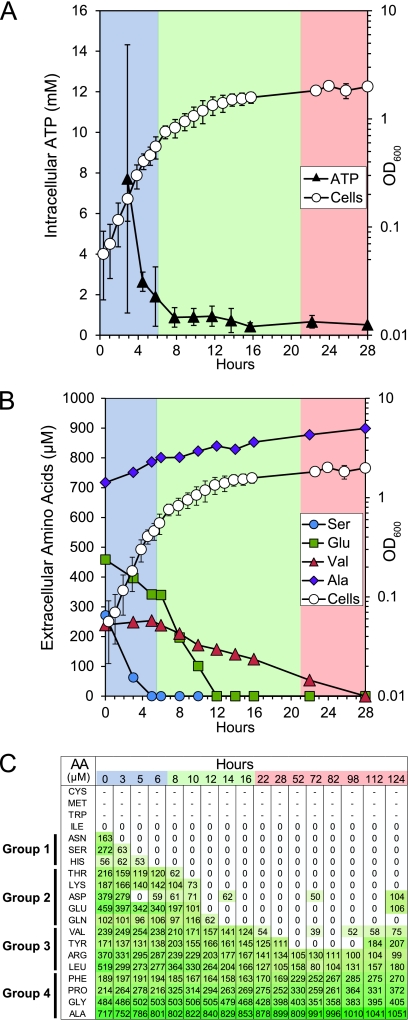
Fig 3.
Intracellular ATP concentrations and extracellular amino acid concentrations during anaerobic growth of GLBRCE1 in ACSH. (A) Mean intracellular ATP concentration measured during growth in ACSH in relation to cell density (same as in Fig. 1). Error bars represent the ranges of measurements. (B) Rates of depletion of individual amino acids that were representative of groups of amino acids with similar depletion patterns during the fermentation. Serine, group 1; glutamate, group 2; valine, group 3; alanine, group 4. (C) Time-dependent changes in concentration of all amino acids detectable in medium during growth in ACSH bioreplicate 1. Group assignments are on the left. Cysteine, methionine, tryptophan, and isoleucine were not detected (see the text). The growth data are from Fig. 1. The shading in panel C reflects the amino acid concentration (with darker shades of green representing higher concentrations).

