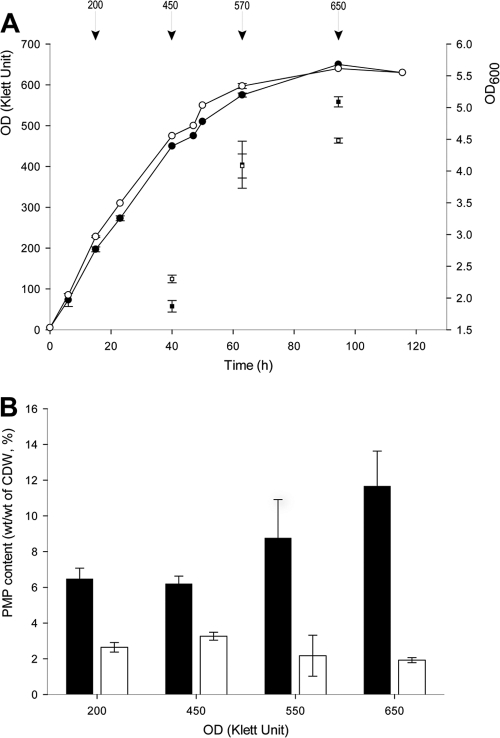
Fig 5.
Relationship between cell amount and PMP production. (A) Growth curves of different strains. Symbols: ●, growth curve of strain SHX5 in the first cultivation stage; ○, growth curve of strain SHX13 in first cultivation stage; ■, OD600 of strain SHX5; □, OD600 of strain SHX13. Arrowheads indicate the time points when the cells were transferred from the first to the second stage. (B) PMP content relative to cell growth in the first stage. Black bars, strain SHX5; white bars, strain SHX13. The error bars represent the standard deviations from three independent experiments.

