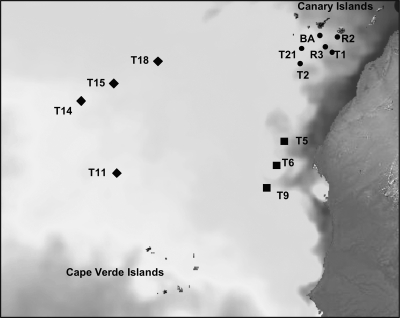
Fig 1.
Positions of the stations occupied during the RODA-II cruises in February 2007. Full circles indicate stations located in the eddy field south of the Canaries, squares indicate stations close to the African upwelling, and diamonds represent stations sampled in the open ocean. Surface temperature was obtained from the Met Office (National Centre for Ocean Forecasting) Web Map Service via the Godiva2 interface, corresponding to February 2007.

