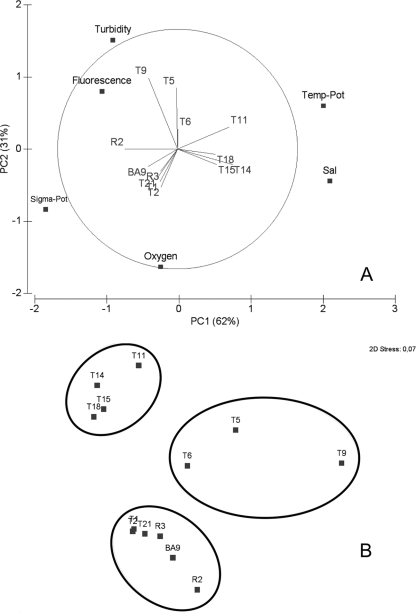
Fig 2.
(A) Principal component analysis (PCA) of the epipelagic physico-chemical and oceanographic data. The first two principal components (PC1 and PC2) explain most (93%) of the variance in the data set. Pot, potential; Sal, salinity. (B) Nonmetric multidimensional scaling with a hierarchical cluster analysis (Euclidian distances) overlain (ellipses showing Euclidian distance of 3) to indicate the clustering of the sampled stations.

