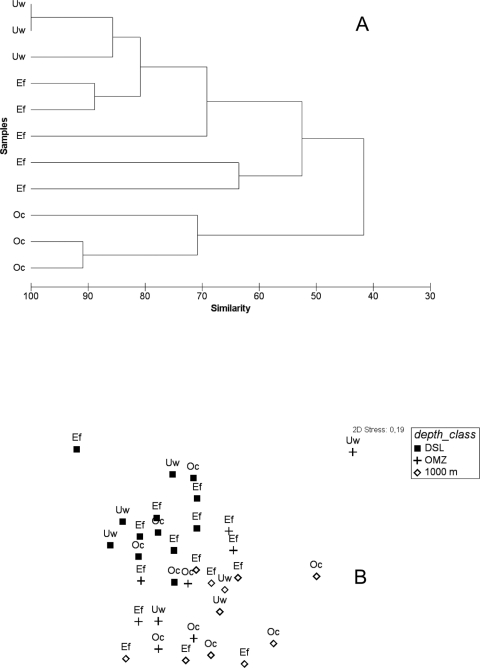
Fig 3.
(A) Similarity matrix of the fingerprinting pattern in bacterial community composition as revealed by ARISA for epipelagic. (B) Nonmetric multidimensional scaling from the ARISA pattern for mesopelagic. Both peak presence alone and peak height were used for the statistics, yielding similar results. DCM, deep chlorophyll maximum; DSL, deep scattering layer; OMZ, oxygen minimum zone.

