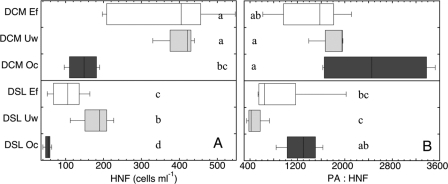
Fig 7.
Distribution of the abundance of heterotrophic nanoflagellates (HNF, cells ml−1) (A) and the prokaryote:heterotrophic nanoflagellate abundance ratio (PA : HNF) (B) in the deep chlorophyll maximum (DCM) and the deep scattering layer (DSL) of the three oceanic regions: Ef, eddy field region south of the Canary Islands; Uw, influenced by coastal waters of the NW African upwelling; and Oc, open-ocean waters of the NE Atlantic Subtropical Gyre. Letters denote significant differences between regions for the epipelagic and mesopelagic waters (one-way ANOVA mean comparison [alpha = 0.05]).

