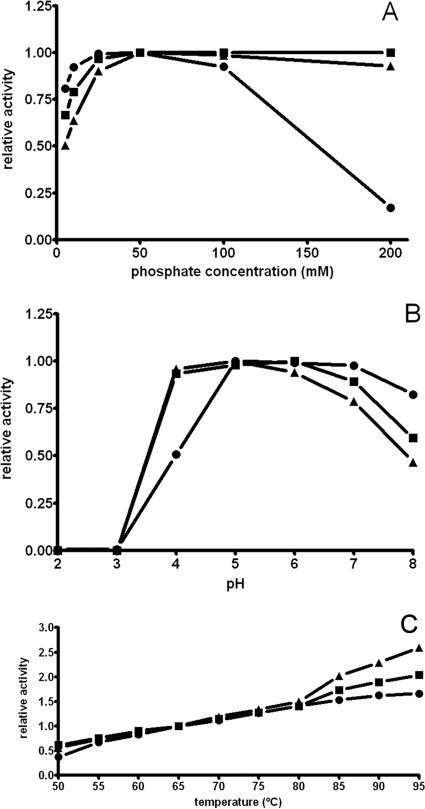
Fig 4.
Optimization of reaction conditions, i.e., the phosphate buffer concentration (A), medium pH (B), and temperature (C) in phosphorolytic reactions carried out by TtPNPI (■), TtPNPII (▲), and TtPyNP (●). The values on the y axis correspond to the residual activity, where 1 is the activity under standard conditions (50 mM sodium phosphate buffer [pH 7.0], 65°C).

