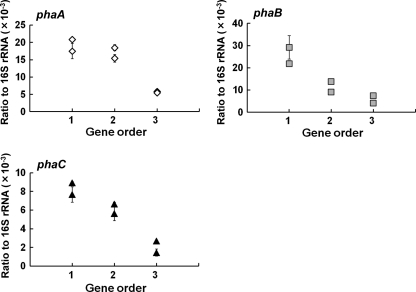
Fig 4.
pha gene expression levels with respect to gene order in recombinant E. coli DH5α harboring pGETS109-pha series plasmids. The x axis displays the gene order, with the gene closest to the promoter represented by 1 and the gene farthest from the promoter represented by 3. The y axis shows the relevant mRNA abundances of pha genes compared to 16S rRNA gene abundance determined by real-time PCR analysis. Experiments were carried out in triplicate, and the average and standard deviation for each point is shown.

