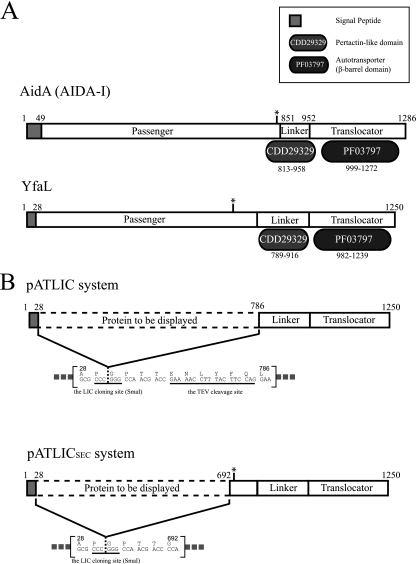
Fig 1.
Schematic diagrams for the domain organization of autotransporter (A) and the display system designed in this study (B). (A) Domain organizations of AIDA-I and YfaL of E. coli. The annotated domain names from the Pfam and CDD databases are shown in a separate box. The predicted cleavage sites of passenger domains are indicated by asterisks (between Ser846 and Ala847 for AIDA-I and between Asp696 and Ile697 for YfaL). (B) The designed surface display system, including a TEV cleavage site (pATLIC) (top) or a predicted cleavage site (pATLICsec) (bottom).

