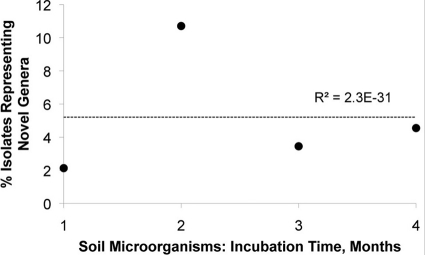
Fig 4.
Proportion of soil isolates (●) representing novel genera among all soil isolates. Data on weekly observations were pooled by month to minimize scatter. Scatter was due to the relatively low number of substantially novel isolates observed on a weekly basis. Regarding the low R2 value, see the legend to Fig. 3.

