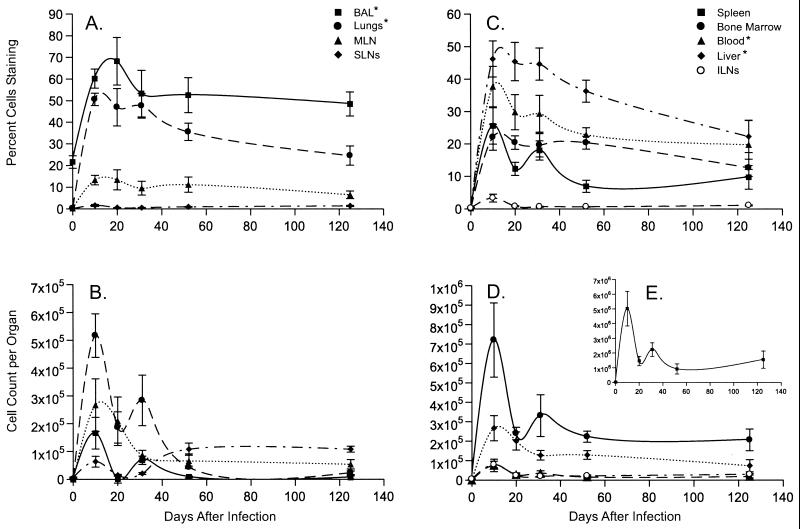
Figure 1.
Expansion and maintenance of the immunodominant CD8+DbNP366+ T cells. It is important to note that the scales on the y axis differ for A–E. The results for lymphocyte populations recovered directly from the site of virus-induced pathology (BAL and lung) are grouped with those for the draining LNs (MLN and cervical LN, the latter included in the SLNs) in A and B, and the findings for the other sites sampled are shown in B, D, and E. Cell numbers (B, D, and E) were calculated from the frequencies (A and C) and the total CD8+ T cell counts (data not shown) for the particular organ. Epitope-specific CD8+ T cell counts for the spleen were generally 10-fold higher than for any other tissue. * denotes that the frequencies (A and C) were significantly higher in these samples than in the MLN throughout the course of the experiment.

