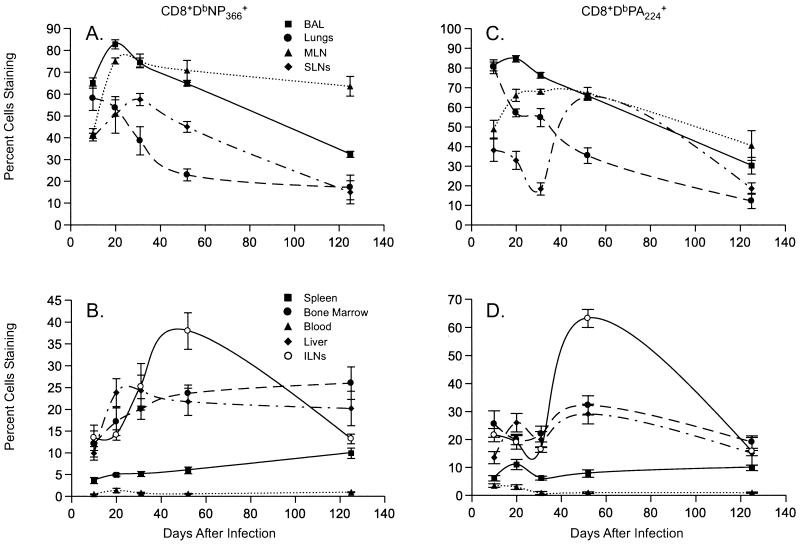
Figure 3.
Distribution profiles of CD69hi virus-specific CD8+ T cells. The frequency analysis for the CD69hiCD8+DbNP366+ populations is presented in A and B and for the CD69hiCD8+DbPA224+ sets in C and D. As described in the legend to Fig. 1, the results for sites associated directly with the pneumonic lung are shown in A and C, and the findings for the blood, BM, and other solid tissues are in B and D. The scales on the y axis differ for A–D.

