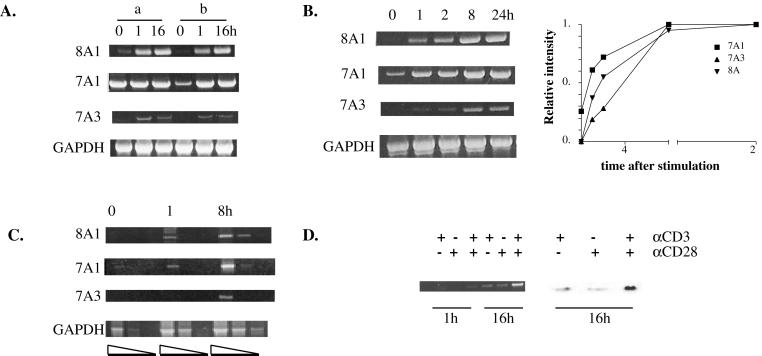
Figure 2.
Up-regulation of PDE7A1, PDE7A3, and PDE8A1 mRNA in CD4+ T cells. CD4+ T cells were stimulated with CD3 and CD28 antibodies and harvested at the indicated time points (hours). RT-PCR analysis was performed as described in Materials and Methods. (A) Comparison of methods of preparation of CD4+ T cells. Cells were prepared as described in Materials and Methods by using either the CD4+ T cell isolation kit in combination with the CD69 microbeads (a) or a mixture of mAbs and goat anti-mouse magnetic beads (b). (B) Time course of the induction of PDE7A1, PDE7A3, and PDE8A1 mRNA compared with a GAPDH control. The bands were scanned and quantified by using nih image. Within each image, the maximum intensity of the band was set to a value of 1 and other bands were calculated as a fraction of the maximum. The values were normalized to the GAPDH signal. The results of the densitometry are graphed. (C) Time course of induction of PDE7A1, PDE7A3, and PDE8A1 by using serially diluted cDNA as described in Materials and Methods. (D) RT-PCR was performed for PDE8A1 from cells harvested at 1 and 16 h after stimulation by using either CD3, CD28, or a combination of the antibodies (Left). Cells were harvested 16 h after stimulation and analyzed by Western blotting by using a PDE8A1 polyclonal antibody (PIL9) (Right).

