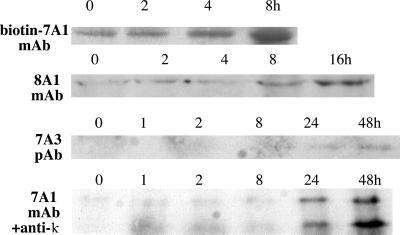
Figure 3.
Western blot analysis of CD4+ T cells shows up-regulation of PDE7A1, PDE7A3, and PDE8A1 proteins. Cells were harvested at various time points and analyzed by Western blotting as described in Materials and Methods. The bottom blot is developed with PDE7A1 mAb and goat anti-mouse-κ-horseradish peroxidase secondary antibody and shows both PDE7A1 (upper band) and PDE7A3 (lower band).

