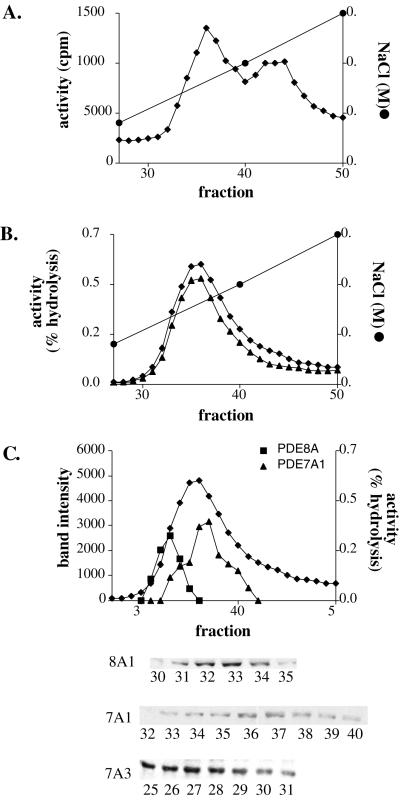
Figure 4.
Mono Q HPLC profile of the Hut78 cell extract. (A) PDE activity of a Hut78 cell extract by using 1 μM cAMP as a substrate. (B) PDE activity profile by using 0.01 μM cAMP as substrate in the absence (♦) or presence of 10 μM rolipram (▴). (C) The PDE activity profile (0.01 μM cAMP, ♦) overlaid with the band intensities (in arbitrary units) of PDE7A1 (▴) or 8A1(■) from the Western blots in the Inset below. The PDE7A3 band eluted in a region with low activity.

