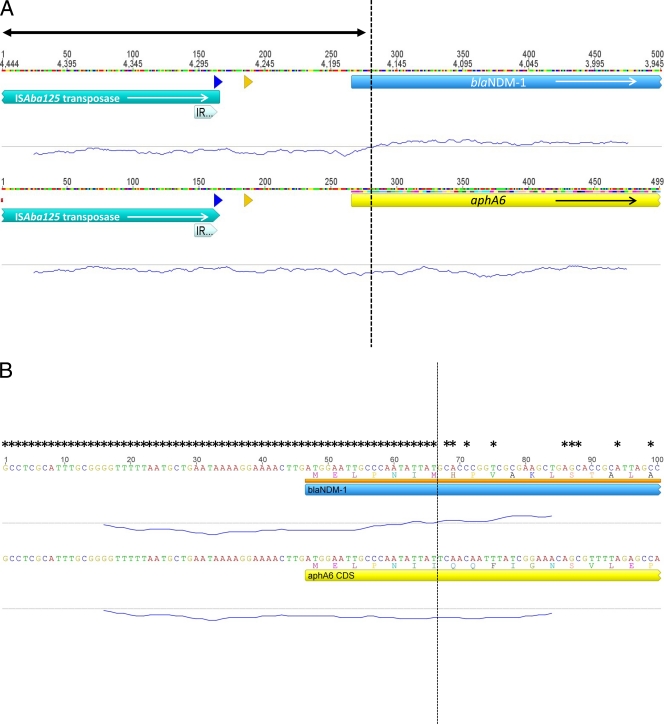
Fig 2.
(A) Alignment of 500-bp sections of DNA, including the 5′ ends of blaNDM-1 and aphA6 genes and 260 bp of upstream sequence. Open reading frames (ORFs) are depicted as colored blocks with arrows indicating the direction of transcription. The double-ended arrow indicates the region of sequences that are 100% identical. The right inverted repeat of ISAba125 is depicted as a thick arrow at the end of the transposase ORFs. Promoter sequences are depicted as a blue arrow at −35 and a yellow arrow at −10. The trace underneath each sequence represents the GC%, which was calculated using a sliding window of 45 bp, and the dashed vertical line indicates the point at which the GC% changes from below 50% to above 50% within the blaNDM-1 sequence. (B) Amplification of 100-bp section of alignment A, indicating the shared first six amino acids of NDM-1 and AphA6 and the exact nucleotide sequence of each region. Asterisks indicate nucleotides that are identical in the two loci; the dashed vertical line indicates the exact site of the gene fusion for all other annotations as described above.

