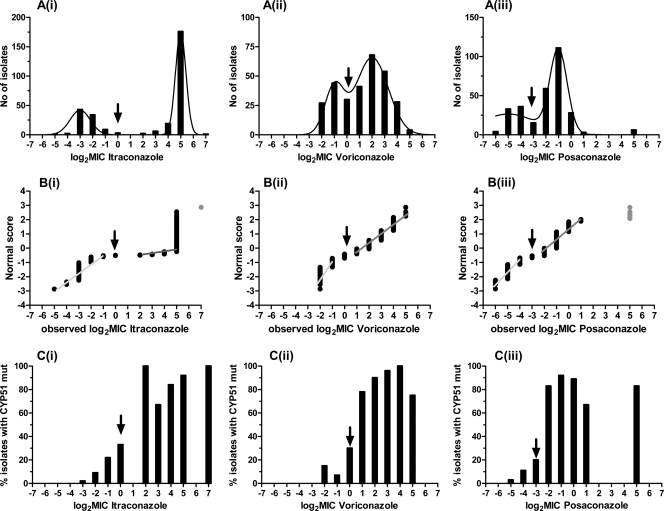
Fig 1.
Distributions of 296 MICs (A), normal score plots (B), and percentages of isolates harboring cyp51A mutations (C) for itraconazole (i), voriconazole (ii), and posaconazole (iii). Arrows indicate ECVs that separate low and high MIC groups. Gray dots were not included in the analysis because they were off scale.

