
Figure 1.
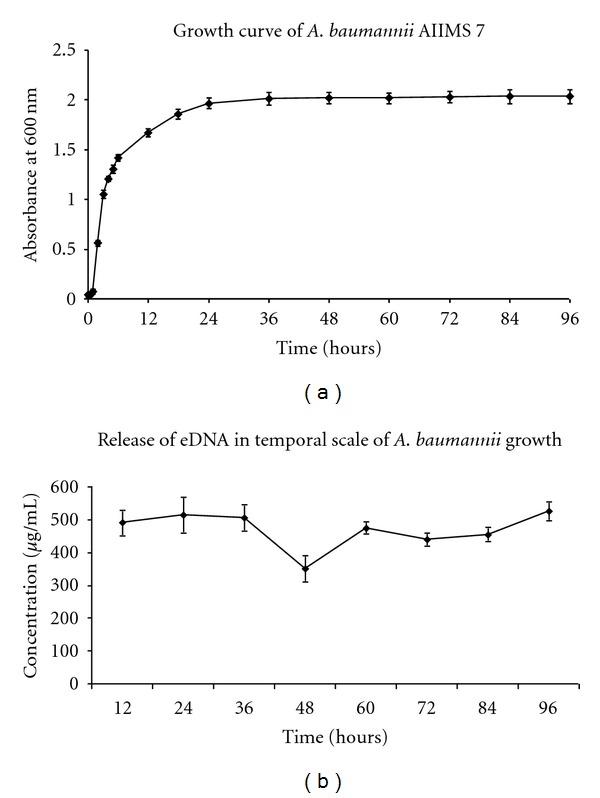
(a) Growth curve of Acinetobacter baumannii AIIMS 7. (b) Pattern of eDNA release in temporal scale of A. baumannii AIIMS 7 growth. Graph representing concentrations of eDNA purified from cell-free supernatant of A. baumannii AIIMS 7 at respective time points. The pattern shows a depression at 48 hour, otherwise showing almost steady presence of eDNA in extracellular medium. (Concentrations of eDNA: 490 ± 54.74, 515 ± 40, 505 ± 39.05, 350 ± 17.55, 475 ± 20.56, 440 ± 20.61, 455 ± 27.83, 525 ± 44.43 μg/mL, respectively, at 12, 24, 36, 48, 60, 72, 84, and 96 hours).