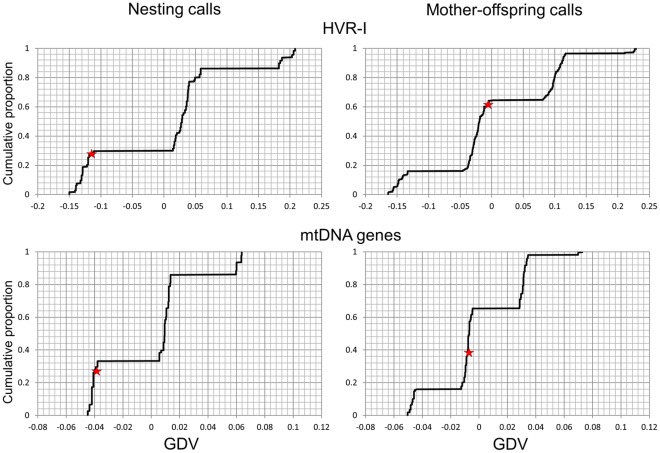
Figure 4. Cumulative distribution of randomised genetic differentiation values (GDV) among populations.
GDVs were generated as follows: the observed behavioural states were randomly assigned to each of the 5 sites a thousand times, thereby producing site pairs with the same, but also with different behavioural states compared to those that were originally observed for each randomisation. For each randomisation, we then calculated GDV, defined as the difference between the averaged genetic maximum composite likelihood distance among sites pairs with different behavioural states and the averaged genetic maximum composite likelihood distance among site pairs with the same behavioural state. If genetic similarity played a role in the observed pattern, the observed GDVs are expected to be positive. The star indicates the value actually observed in this study.

