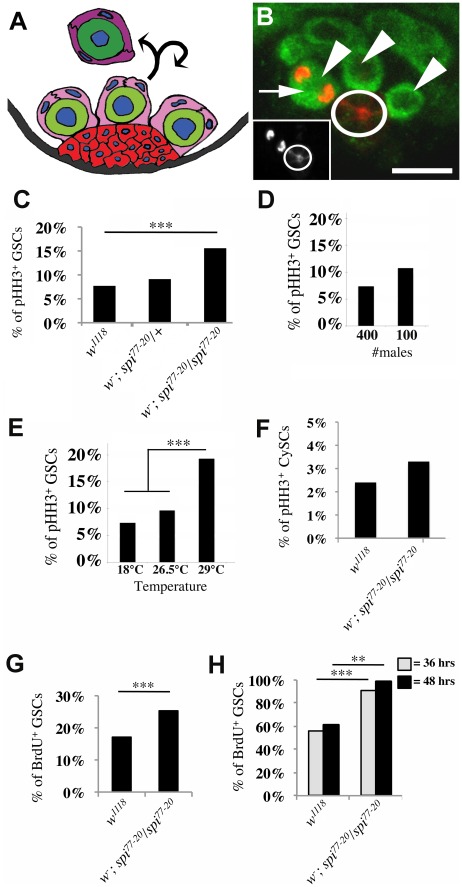
Figure 1. GSCs in spi77-20 testes cycle faster than GSCs in control testes.
(A) Cartoon depicting the organization of germ line cells and somatic cells at the tip of wildtype testes. GSCs (light green) are organized around the hub (red). CySCs (light pink) encase GSCs and are also in contact with the hub. The gonialblast (dark green) is displaced away from the hub and encased by two cyst cells (dark pink). (B) The apical tip of a w1118 testis stained with antibodies labeling the cytoplasm of the germline cells (anti-Vasa, green), the membrane of the hub cells (anti-Fasciclin III, red), and mitotic chromatin (anti-pHH3, red). Arrowheads: GSCs, arrow: GSC in mitosis, scale bar: 10 µm. The inset shows the pHH3-positive GSC next to the hub (circle). (C–H) Genotypes as indicated. >500 stem cells were scored for each genotype. (C–E) The percentage of pHH3-positive GSCs (M-phase index). (C) ***p-value<0.0001. (D) Conditions as indicated. p-value = 0.18 (E) Conditions as indicated. ***p-value<0.0001; No significant difference was noted between 18°C and 26.5°C, p-value = 0.22. (F) The percentage of pHH3-positive CySCs. No significant difference was noted. p = 0.28. (G,H) GSC S-phase indices. (G) Ex vivo labeling of testes with BrdU, ***p-value = 0.0004. (H) Flies fed a continuous diet of BrdU for 36 hours or 48 hours, ***p-value<0.0001, **p-value = 0.0074.

