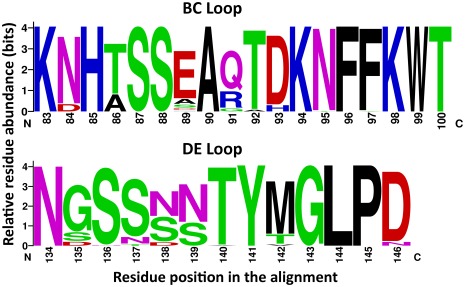
Figure 6. Relative residue abundance at the alignment positions of BC and DE surface-exposed loops.
The graphical representation was generated using WebLogo. The height of symbol indicates the relative frequency of the corresponding amino acid at that position. Residue positions are given based on the nucleotide positions of the Fermon strain (AY426531).

