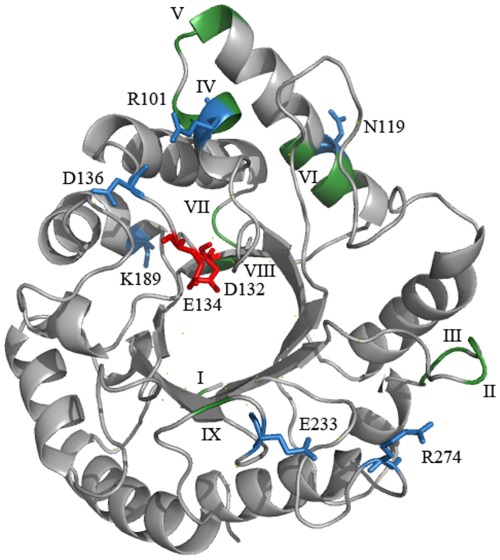
Figure 1. Trichoderma atroviride Eng18B homology model.
Ribbon diagrams of the catalytic module of Eng18B, based on the structure of T. reesei Eng18A (PDB entry 4AC1) showing the conserved catalytically important residues in red; variable regions from reverse conservation analysis (Wmeans) in green; and highly variable amino acid positions with Sscore ≥3 in blue. Variable regions are marked in Roman numerals from N- to C- termini.

