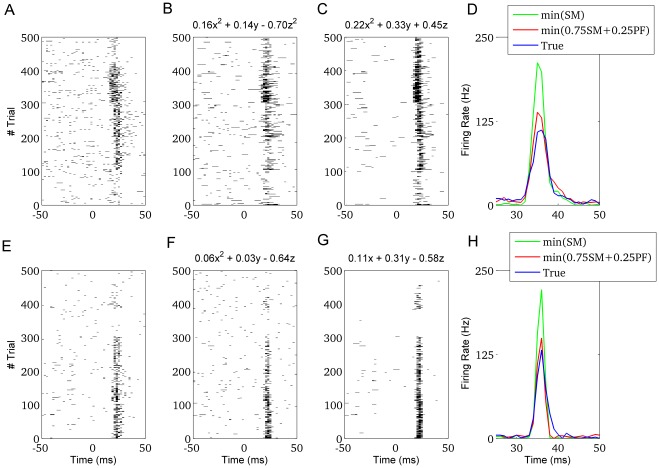
Figure 4. Multi-objective model optimization: extreme solutions and trade-offs.
A) Binarized response for the neuron in Fig.1A. B) Predicted response for a model belonging to the optimal Pareto front. The predictive performances of this model represent a suitable trade-off between  and
and  . C) Predicted response for a model belonging to the optimal Pareto front. This model has the best predictive performances for
  at the expense of a significant worsening in
  . D) Average response for the true neuron (blue) and the model in (B) and (C) (respectively red and green lines). E-H) Same as (A-D) for a different cell. For the model in (F)
  and
and  are respectively 0.70 and 0.41. For the model in (G)
  = 0.64 and
  = 0.61. The smallest
  achievable was 0.36 (but for
  = 0.74).

