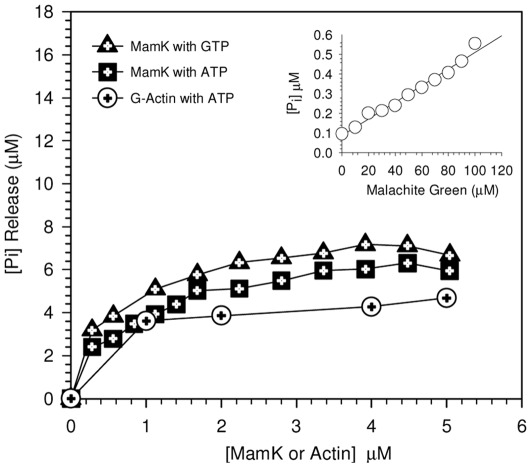
Figure 3. Comparison of ATPase and GTPase activity of MamK with G-actin monitored using a phosphate release assay.
Polymerization was initiated by addition of nucleotide at a concentration of 0.2 mM and the (a) hydrolysis for ATP and GTP was monitored by measuring the release of inorganic phosphate, (Pi) at 630 nm at 30°C as function of concentration. For MamK, the liberation of Pi was followed in polymerisation buffer and in G-actin buffer for G-actin. The insert shows the Pi -malachite green complex formed in the absence of protein under the same conditions for the rates observed in the presence of protein and were corrected for using the malachite-green standard curve.

