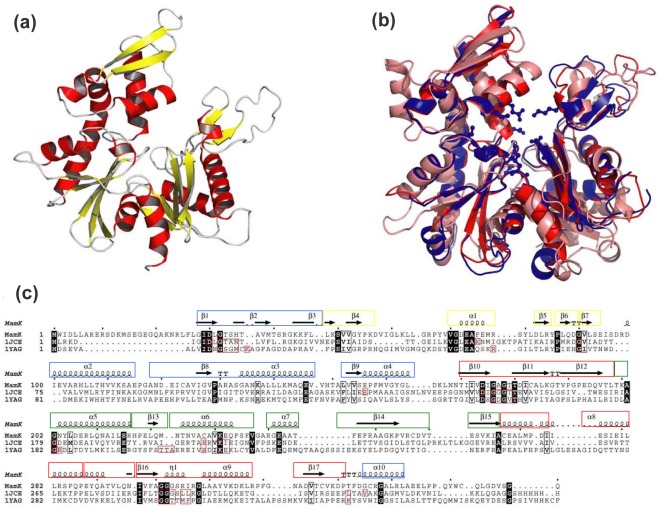
Figure 6. Comparison of the three dimensional and secondary structures of actin and MreB with the predicted structure of MamK.
(a) Cartoon representation of the model generated for MamK. (b) Structural superposition of MamK (red), MreB (blue; pdb entry: 1jce) and actin-F (salmon; pdb code 1yag). Those residues involved in nucleotide binding are shown as sticks and balls for MreB. (c) Secondary structural alignment for the three proteins with the active-site residues marked with red boxes as well as the conserved residues shaded in black boxes. The secondary structural elements (β-strands and α-helices) that correspond to conserved domain regions are boxed in blue and red for subdomains DLI and DLII and the variable regions are boxed in green and yellow corresponding to subdomains DSI and DSII.

