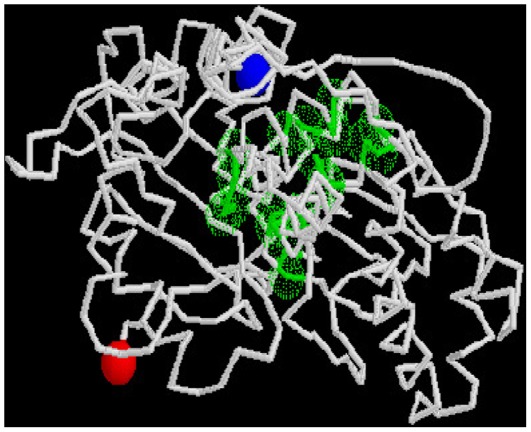
Figure 7. Predicted binding site of MamK.
GLY :32(1.29) THR :33(1.29) SER :34(1.29) HIS :35(1.29) GLU :156(0.52) GLY :176(1.29) ALA :177(1.29) THR :179(1.03) GLY :202(1.29) ASN :203(0.80) CYS :228(1.29) LYS :231(1.29) GLU :232(1.29) SER :235(0.74) GLY :301(1.04) GLY :302(1.29) GLY :303(1.29) ARG :305(1.29) ILE :306(1.29) THR :332(1.04). Binding site residues reported above are derived from a consensus prediction of the top 10 functional homologs, which are selected on the basis of structural alignment between the predicted model and the PDB structures. Values shown inside the parenthesis beside each residue reflect the relative frequency with which the predicted residue in the model structurally aligns with known binding site residue in the functional homolog(s). A relative frequency >1 signify a binding site residue prediction with high confidence and vice-versa. Predicted binding site residues are shown in green sphere while N and C terminus in the model are marked by blue and red spheres respectively.

